Graph Analysis
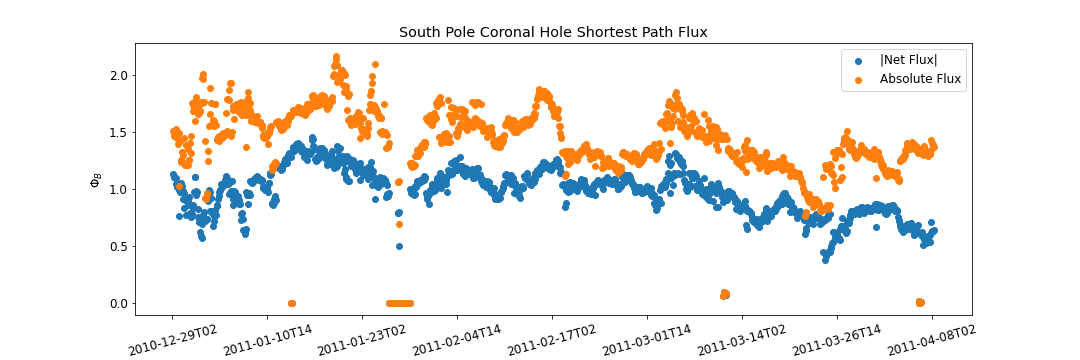
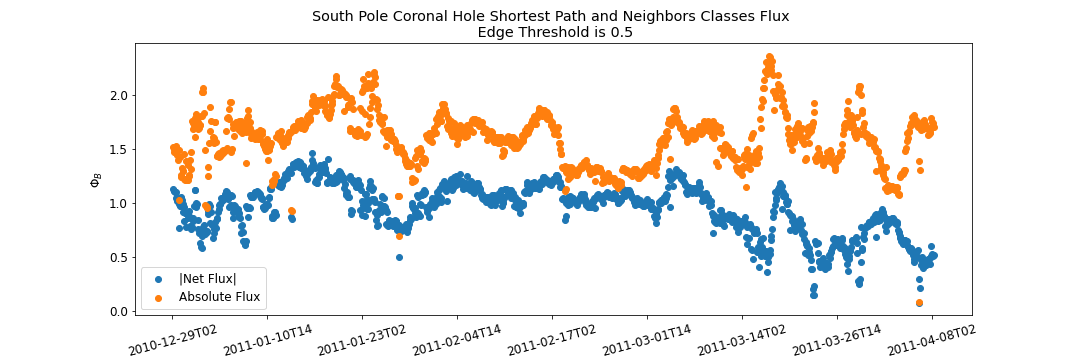
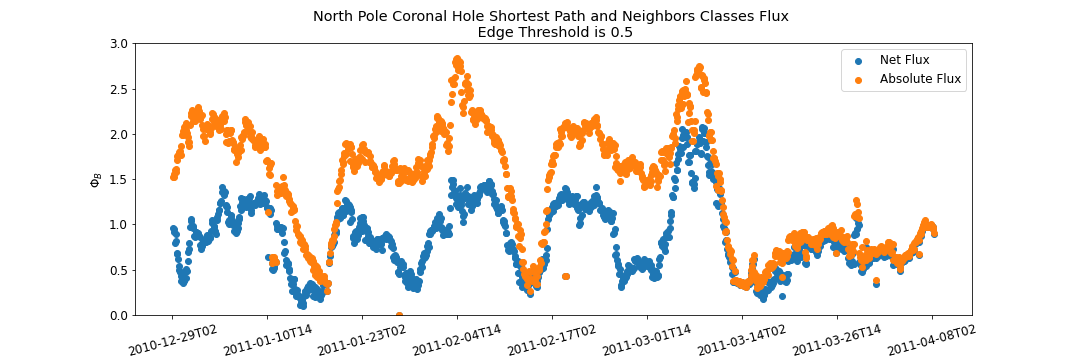
The following section will analyze the results of the tracking algorithm on the time interval of 100 days from December 29th, 2010 to April 8th, 2011 (with 2 hr cadence).
Graph Results
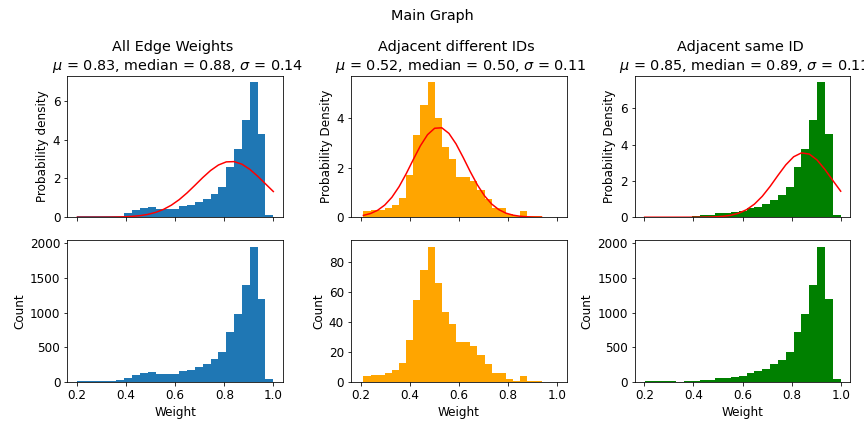
- Total number of nodes: 8467
- Total number of edges: 8742
- Number of edges between nodes of the same ID: 8172
- Number of edges between nodes with different ID: 570
- Total number of subplots: 210

Graph Traversal
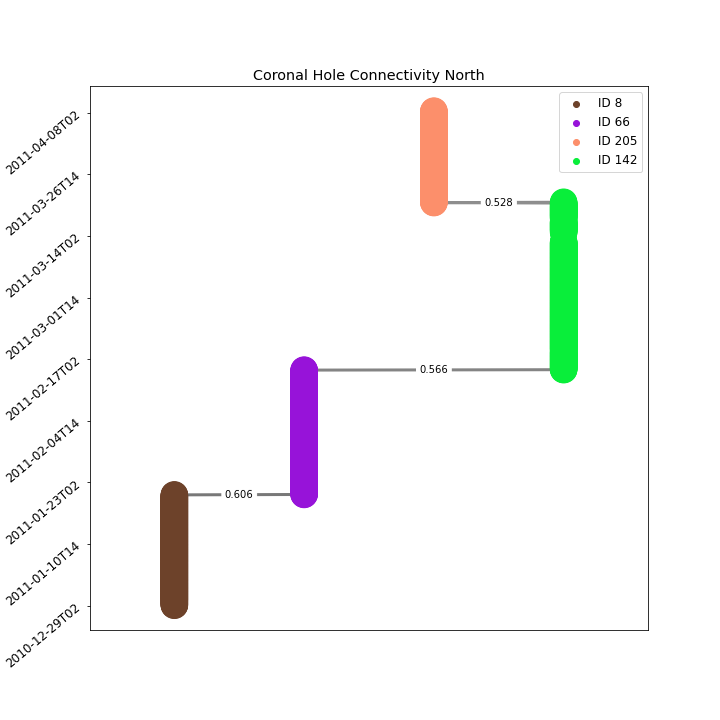
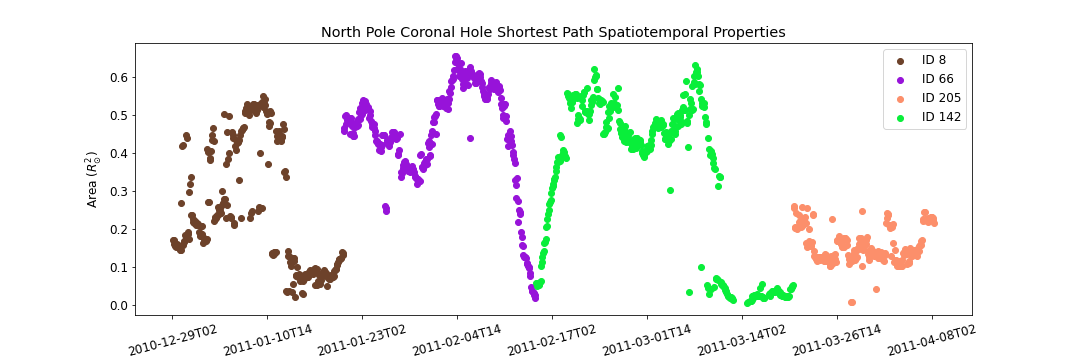
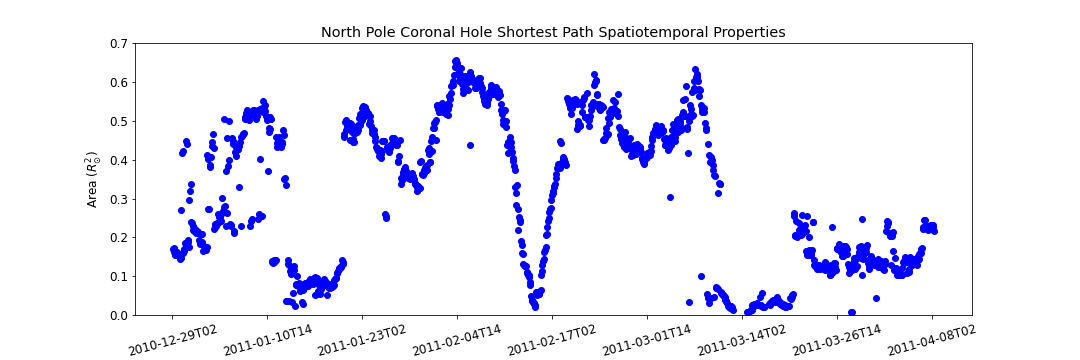
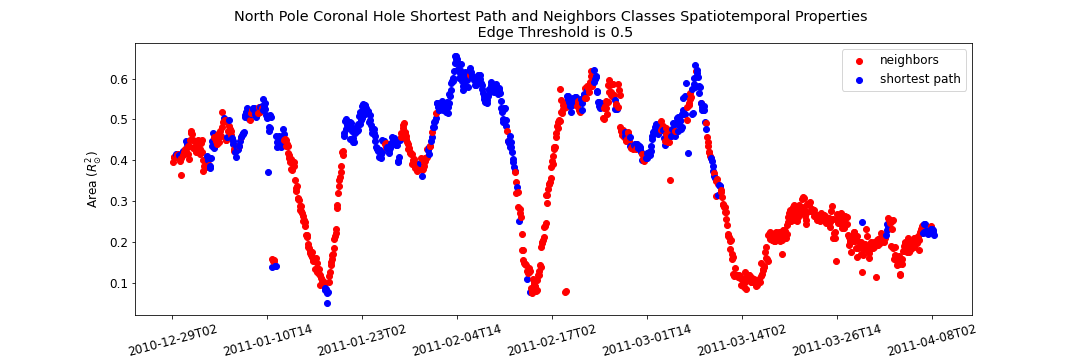
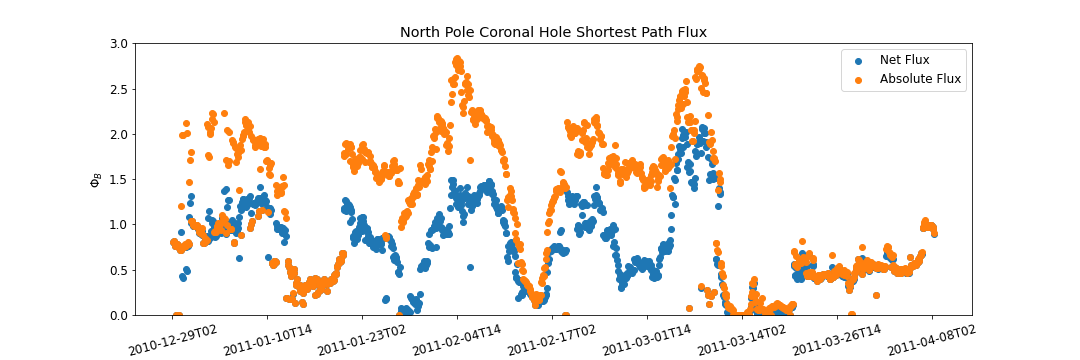
Graph Traversal refers to the process of searching each edge in a graph. How can we find the optimal path that will represent the spacial temporal evolution of a given coronal hole? We can think about traversing the coronal hole connectivity graph as a variant of the "traveling salesman problem", where the goal is to find the shortest path between two nodes in a finite graph. Here we leverage Dijkstra's shortest path Algorithm to find the optimal path. The cost function used to set up the minimization problem is as follows
Where n_{1}, n_{2} are two arbitrary nodes and w(n_{1}, n_{2}) is the edge weight between the two nodes. Such cost function will minimize the number of explored classes, and enforce the route of more long-lasting coronal holes. Also, such cost function will favor the paths with stronger area overlap association.
North Pole Coronal Hole Evolution
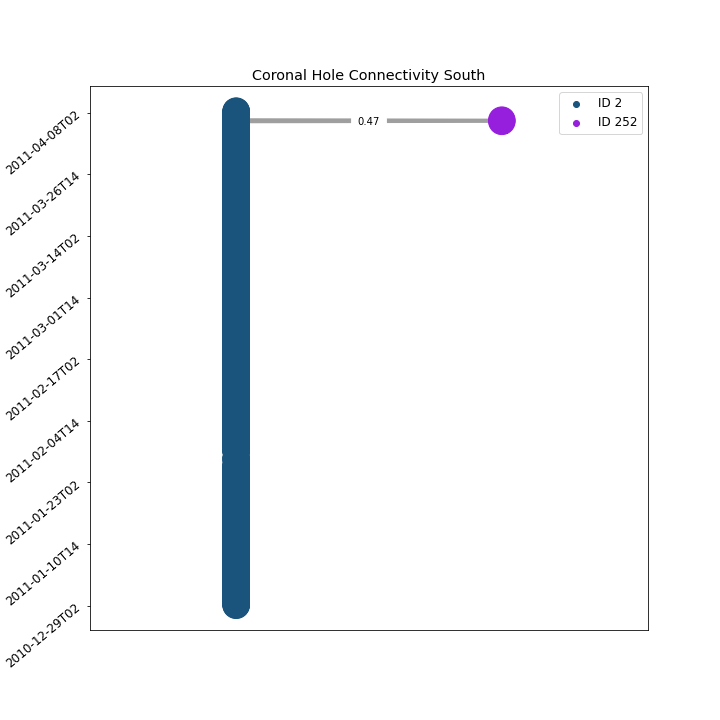
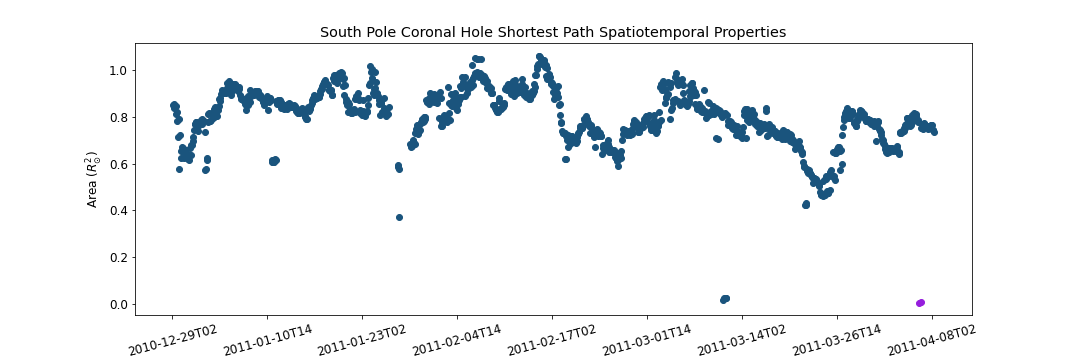
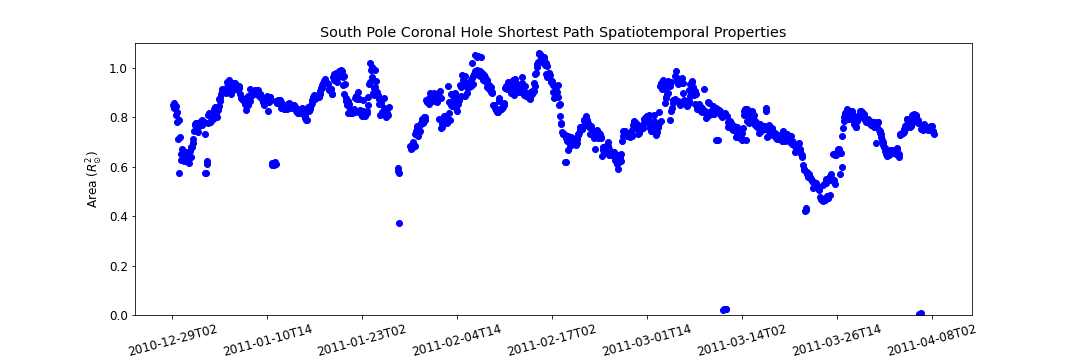
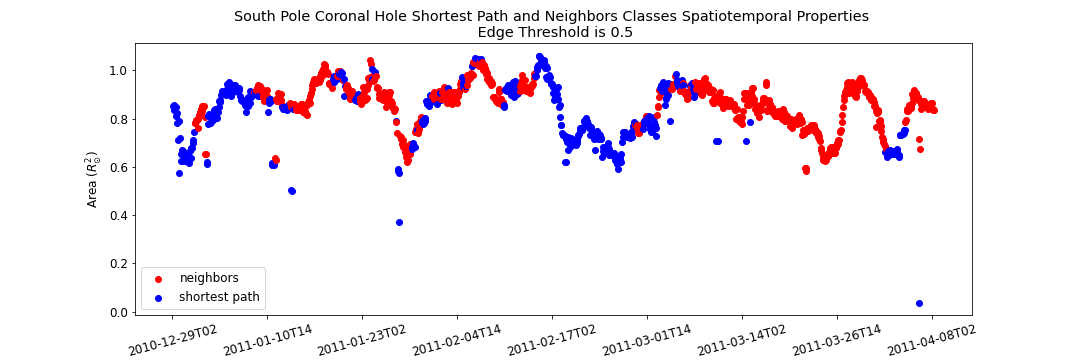
South Pole Coronal Hole Evolution
